|
|
Driving east on Highway 36 Flanigan Creek is located
between MS Weares and Hely Creek monitoring sites, but is much
closer to MS Weares. Flanigan Creek is a tributary of the main
stem Van Duzen River, and merges with the river just upstream
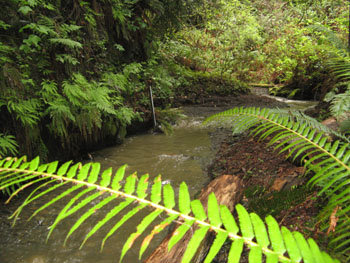
from the junction of Fox Creek. The monitoring site is tucked
well into the redwood forest, but relatively close to Highway
36. The catchment area for Flanigan Creek is the smallest of the
11 areas included in the Van Duzen Watershed Project, and encompasses
approximately 1.57 miles of stream network. The site is located
in the redwoods with an adequate component of hardwoods within
the riparian zone around the stream. Elevations in Flanigan Creek
range from 154 feet at its mouth to over 1,250 feet in the upper
reaches, and the monitoring site is approximately 210 feet in
elevation. The watershed is completely in private ownership with
virtually all timber holdings and timber harvests conducted by
Humboldt Redwood Company (formerly PALCO). Vegetation is predominantly
mixed and evergreen (Redwood) forest throughout. The catchment
area of a monitoring site is important when considering upslope
factors that affect water quality in the stream. This area represents
the true watershed that lies above the point where water from
the stream is sampled, and from which all rainfall and sediment
are channeled into the stream down to the point where water is
withdrawn for turbidity and suspended sediment analysis.
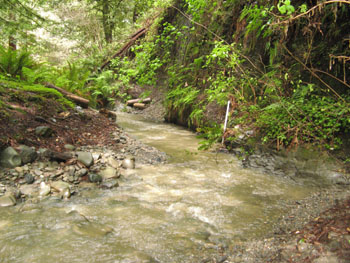
Stream discharge is directly proportional to the
size of the catchment area - the greater the area, the more water
is carried by the stream during storm events. Flanigan Creek is
relatively small compared to other streams in the study, and the
stream drains an area of approximately 1.69 square kilometers
which is equivalent to 0.65 square miles. During the first year
of sampling (HY07) volunteers recorded a maximum discharge of
14 cubic feet per second (CFS) and an average discharge of 5 CFS,
a maximum turbidity of 1,218 Nephlometric Units (NTU) and an average
turbidity of 140 NTU. In HY08, there was a maximum discharge of
80 CFS and an average discharge of 12 CFS, a maximum turbidity
of 3,036 NTU and an average turbidity of 294 NTU over the winter
sampling season. Over the two seasons combined (HY07-HY08), the
maximum discharge was in HY08 at 80 CFS with an average of 9 CFS,
maximum turbidity was also in HY08 at 3,036 NTU with an average
of 224 NTU. This translates to an average of 2,738 tons of suspended
sediment per square mile per year.
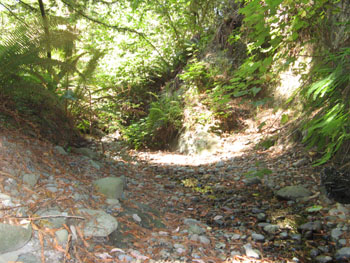
Flanigan Creek used to be a perennial stream but
now does not fully run year round and is therefore referred to
as an ephemeral stream (as opposed to a perennial, year round
stream). As the stream runs considerably dry in the summer, temperatures
during this time of the year were not measured. Flanigan Creek
has a road density of about 7.9 miles of roads per square mile
of watershed. As with all of the catchment areas within the lower
basin, this density of road networks receives a rating of extremely
high. In the 17-year period from 1991 through 2007, the proportion
of the area harvested for timber equaled 126%, with clear cutting
accounting for 56% of the total area. These harvest metrics are
extremely high, and even though Flanigan Creek represents a small
area, the implications for impairment and externalities due to
over harvesting are clear. Proportions greater than 100% are possible
because harvest areas are calculated to include re-entry over
multiple years. Calculation of overlapping THPs in forested lands
helps quantify the impacts of re-entry by logging operations over
multiple years, and sheds additional light on a process known
as cumulative effects.
|